Don't be part of the Web 2.SLOW
The concept of “Web 2.0” captured the imagination of web developers worldwide less than two years ago. But the promise of better user experiences and customer-centric content is regularly silenced by downtime and plagued by poor performance.
Why is this the case? Servers have never offered so much power so affordably, and the software that underpins web applications has matured and is generally very reliable.
In part one of this analysis we examine the factors leading to slow website performance – both on the client and server-side. In part two we look at the causes and impacts of website downtime, and what you can do to minimize them.
JavaScript & CSS: Bloat is Back
Modern websites make extensive use of CSS & JavaScript to deliver highly responsive user interfaces.
With high-powered desktop PCs equipped with fast broadband connections, one can sift vast swathes of scripting and style with carefree abandon. Dialup users, be damned – this is Web 2.0.
It’s not uncommon to view the page source of a web application and find more than ten separate .CSS and .JS resources included. Every external resource required by a page means another HTTP request is needed to fetch it.
Considering that browsers need to fetch all CSS & JavaScript resources before they begin to render a page this spells serious trouble for performance.
Case Study: digg.com
Let’s examine one of the poster-children of Web 2.0, digg.com
Our testing environment is a 180ms round trip away from the web server hosting digg.com. This is a comparatively good situation – we rarely see less than 200ms of latency to US hosted websites on our 10Mbit broadband connection in Australia.
Clearing the browser cache and calling up the Digg homepage, we used Tamper Data to examine every HTTP request made along the way. The results are not encouraging.
We observe over seven seconds of furious HTTP requests before the page even begins to render. These requests fetch thirteen JavaScript includes plus one CSS include.
The total size of the HTTP responses thus far is only 213kB – showing an effective transfer rate of around 35kB / second. This is well below what we could reasonably expect of a broadband connection.
The bottleneck is caused by behavior common to both FireFox and IE – neither browser will, by default, open more than four (just two in IE) connections to a web server simultaneously. So each CSS & JS include must be requested sequentially, and given we have a minimum latency of 200ms every request, the time adds up quickly.
Digg.com compounds this problem by forcing all .JS resources to expire from the cache after just one hour, even though many of them remain unchanged for weeks or even months.
Worse still, even if resources are cacheable for long periods of time, FireFox periodically checks the validity of still-fresh resources by re-requesting them with an “If-Modified-Since” header. Even if the resource remains unchanged, we still incur a minimum 200ms wait for the negative response – again multiplied by the number of separate resources in use.
Solution: Consolidate and Cache
Fortunately the solution to this performance problem is simple – consolidate your style sheets and JavaScript includes, preferably into a single .CSS file and a single .JS file.
By requiring just two resources before page rendering can begin, you ensure that most browsers will fetch them simultaneously, and avoid hitting their “maximum connections per server” limit.
Once consolidated, complex web applications might well find themselves with a 200kB or larger JavaScript resource. In and of itself, this is not a major problem – we would expect to see such a file arrive within two seconds on a modern broadband connection.
But by serving the necessary HTTP headers alongside your .JS and .CSS resources, you can encourage them to be cached aggressively – both by users’ browsers and their ISP’s proxy servers. Given that your CSS and JS includes are unlikely to be changed on a daily basis, this technique will achieve further performance gains.
Application Performance Counts
Another attribute of modern web applications is their heavy reliance on database generated content and, increasingly, data retrieved from 3rd party sources. This brings about two outcomes, firstly that more server-side processing is required to deliver a page to the user, and secondly that pages are tailored for delivery to a specific user.
The upshot of this is that poorly constructed or inefficient server-side software will slow website performance far more now than it once did, and simple caching approaches won’t help you.
Once again using digg.com as our case study, take a look at the following graph showing the home page response time over a 24-hour period, broken down into each component of the HTTP request:
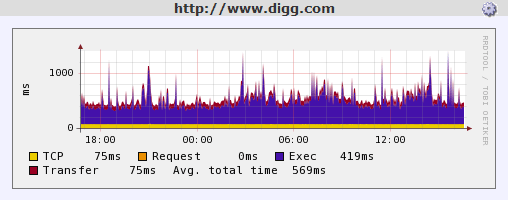
First note the TCP connection time, which remains very constant at 75ms. The transfer time, which measures the time taken to transfer the HTML data comprising digg.com’s home page, is also a constant 75ms.
These measurements indicate that Digg’s web server has adequate network bandwidth to easily cope with fluctuating traffic levels throughout the day. This is a good sign, and suggests that Digg operates within a well-equipped data center.
However the picture is not so rosy when you examine the execution time, shown on the graph in purple. This measurement reveals the amount of time between the moment the HTTP request is delivered to Digg’s web server, and the moment when we receive the first byte of the HTTP response.
We can interpret this as the amount of time it took the web server to process the request and prepare a response – in other words how long the server-side application took to execute.
The graph shows that this figure fluctuates quite widely, ranging from around 300ms to well over 1500ms during peak times. It’s clear that fluctuating traffic levels have a significant impact on the speed at which Digg’s can serve up the home page.
This is, of course, not surprising when you consider the large quantity of traffic Digg receives, combined with its’ computationally intensive story ranking algorithms. Consider, too, that the Digg home page is constantly updated and that there is no shortage of visitors regularly refreshing the page to see what’s changed.
When examining a longer-term graph, though, we can see that application speed has improved markedly in the last couple of weeks:
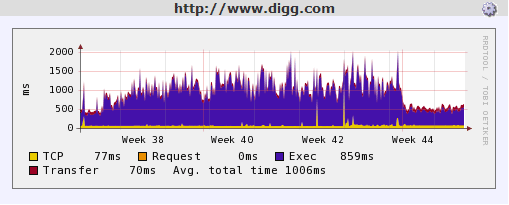
It’s clear that the performance of your web applications is critical to your users’ experience. These graphs highlight the importance of monitoring web application performance over time and interpreting the trends in this data.
It is insufficient simply to measure instantaneous response times, or performance within your development environment. To fully understand – and improve – the performance of your web applications you must examine how your site reacts to fluctuating traffic levels over time.
Continue on to Part II: Availability - The Art of Uptime »
Or:
Downtime Hurts. Start monitoring and stop worrying.
Our monitoring service continually tests your servers & web sites to keep you online and performing fast. Fully-featured plans start from just $44 / month.
But don't listen to our spiel - Decide for yourself with a free trial »