Load Average
Wormly Metrics provides Load Average monitoring - among thousands of other metrics.
Load Average is a metric that indicates the level of load - or stress - that a server is under at a given point in time.
In literal terms, the Load Average is a moving average of the number of system processes that are using the CPU, waiting for CPU time, or waiting on IO.
By monitoring a server's Load Average over a period of time, we can produce a trend graph that provides insight into how efficiently the server is using its' CPU resources. For example:
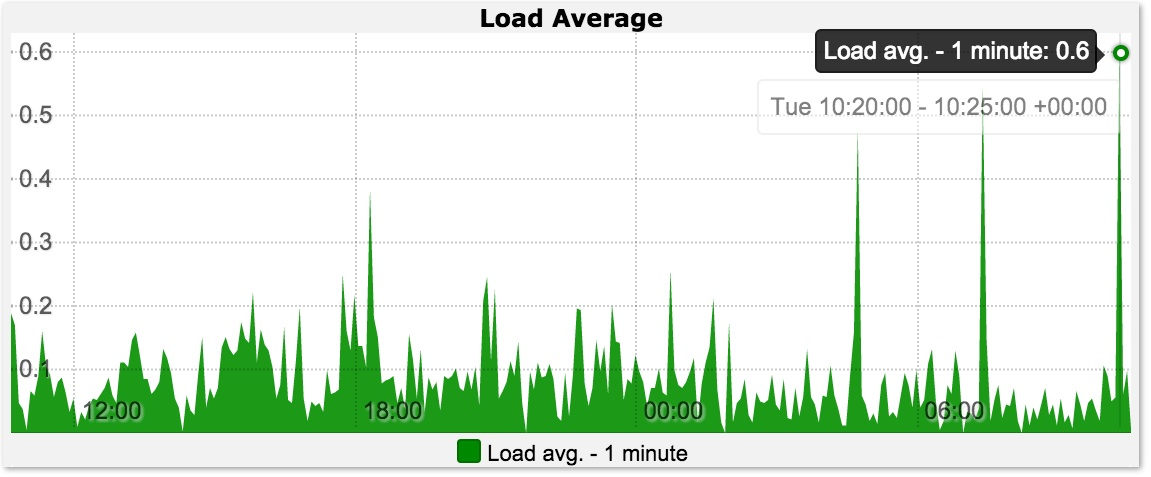
In the above sample, we can see that for most of the 24-hour period shown the (single CPU) server has a load average below 1.0, indicating that processes rarely had to wait for CPU time.
The two large spikes visible in the graph clearly show a substantially higher load level just before 2am, and again between 4am and 5am. We could correlate these spike with other graphs (e.g. Disk IO) to determine specific components of the load.
Performance Graphs
Internal metrics
External metrics
Downtime Hurts. Start monitoring and stop worrying.
Our monitoring service continually tests your servers & web sites to keep you online and performing fast. Fully-featured plans start from just $44 / month.
But don't listen to our spiel - Decide for yourself with a free trial »